What Is a Good LLM Brand Visibility Score? Benchmarks for 2026
There is no universal good LLM brand visibility score, because every tool computes the number from a different prompt set, a different engine list and a different denominator. A "good" score is one that beats your own baseline and your named competitors on the same prompts, the same engines and the same week.
This guide shows what the number is built from, why a 62 in one dashboard is not a 62 in another, and how to build AI visibility score benchmarks you can defend. It also runs two scoring methods on labeled example data so you can see how one appearance rate turns into totals that differ by more than 30 points.
Is There a Good LLM Brand Visibility Score, or Only a Good Baseline?
A score is a ratio, and a ratio is only as meaningful as its numerator and denominator. "Appeared in 40% of answers" means nothing until you know which answers were asked, on which engines, and whether "appeared" means named once, recommended first, or linked.
Three things make a score good in practice. It is measured against a fixed prompt set that mirrors how your buyers actually ask. It is compared against the brands those buyers consider instead of you. And it is repeated often enough that a change is larger than the noise. Miss any one and you are reading weather, not climate.
That is why this post prints no pass mark. Vendors publish ranges for their own metric and papers report distributions for their own prompt sets; neither is a standard for your category. Treat a published range as one tool's calibration and build your own baseline. For the shorter primer, read what an AI presence score is first.
What Is an LLM Brand Visibility Score Made Of?
To understand AI visibility score reports from any vendor, decompose the headline into four ingredients.
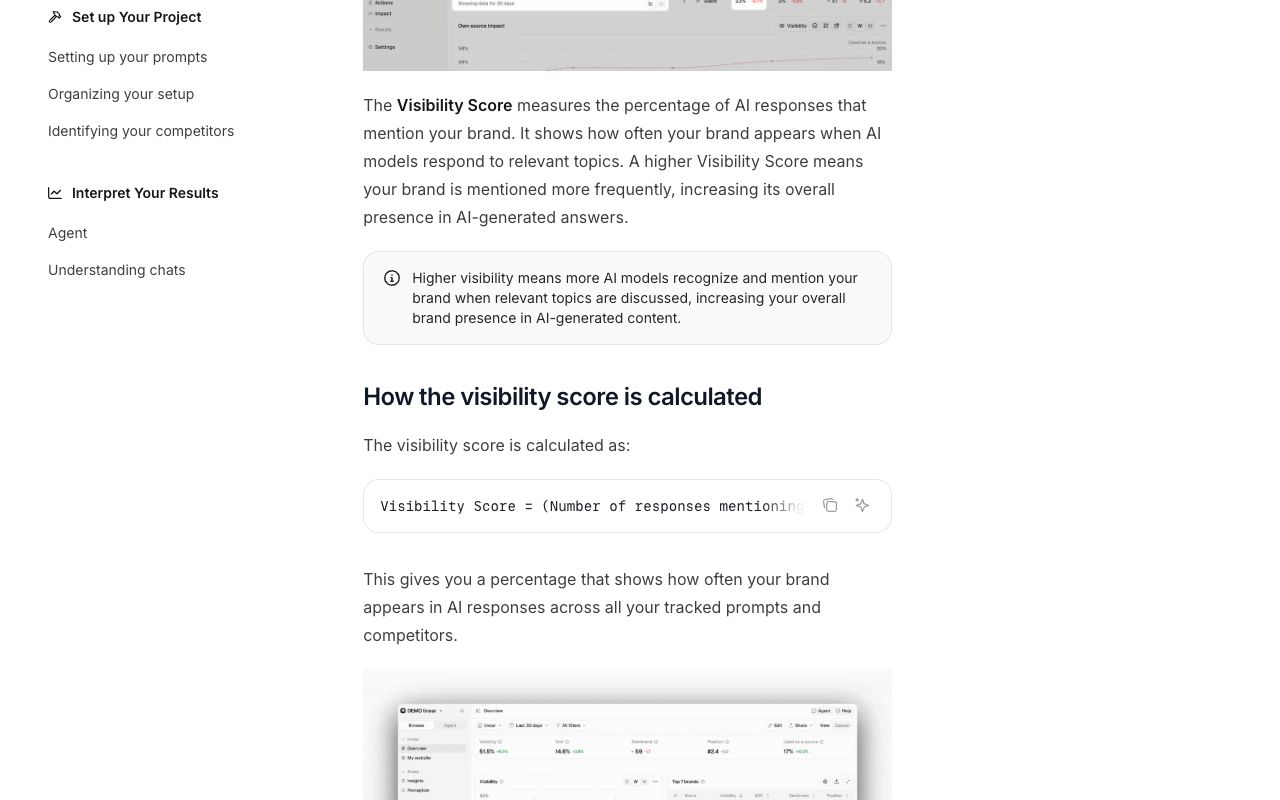
- Appearance rate. The share of answers in which your brand is named at all. Peec's documentation defines its Visibility metric exactly this way: responses mentioning the brand divided by total responses, times 100 (Peec docs, accessed 21 Oct 2026).
- Recommendation position. Whether you are the first name, one of a shortlist, or an afterthought. The GEO paper (Aggarwal et al.) formalized this for cited sources as a "position-adjusted word count" that decays exponentially with position (arXiv 2311.09735, revised June 2024). Brand trackers borrow the same logic for mention order.
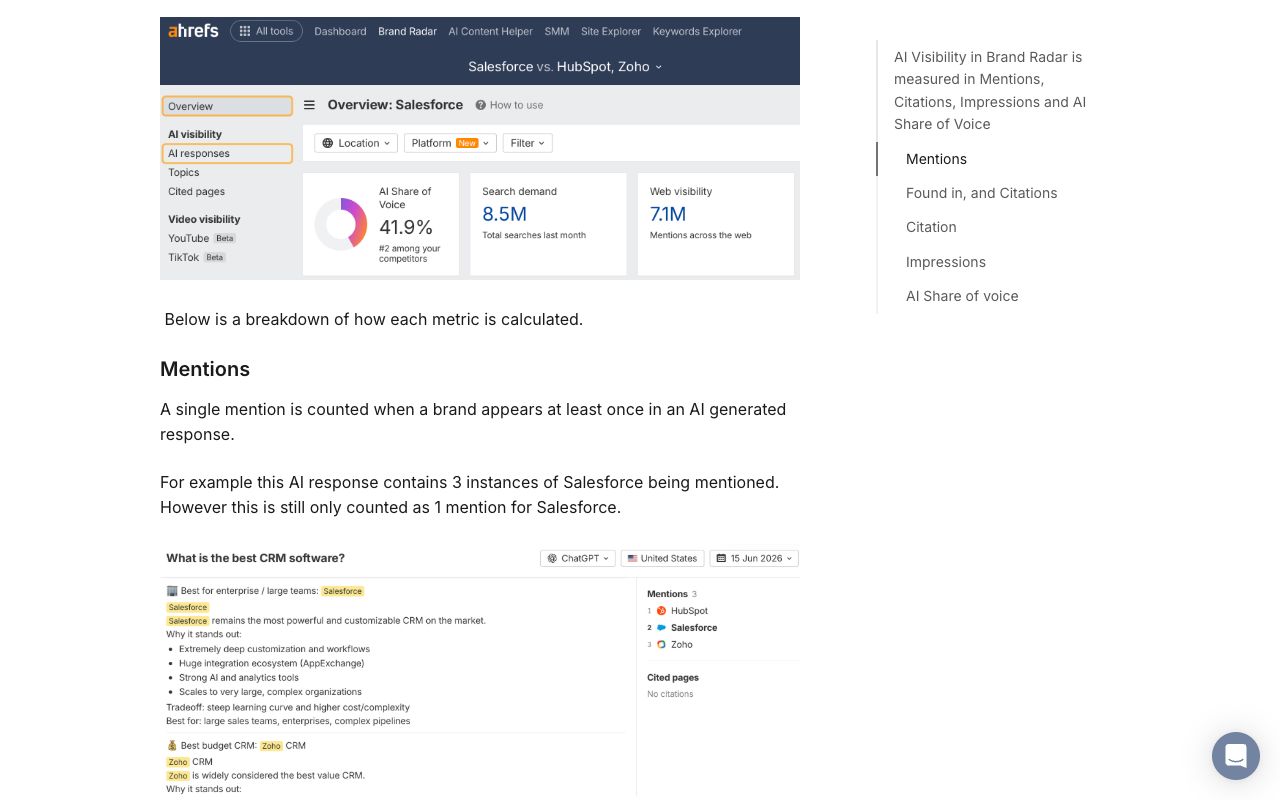
- Citations. Whether the answer links to your domain or to a third party when it talks about you. Ahrefs counts a citation once per response in which a page appears as a cited source (Ahrefs help center).
- Sentiment. Whether the mention is a recommendation, a warning, or a neutral listing. A brand that appears in 80% of answers as "the one people leave" has high visibility and a reputation problem.
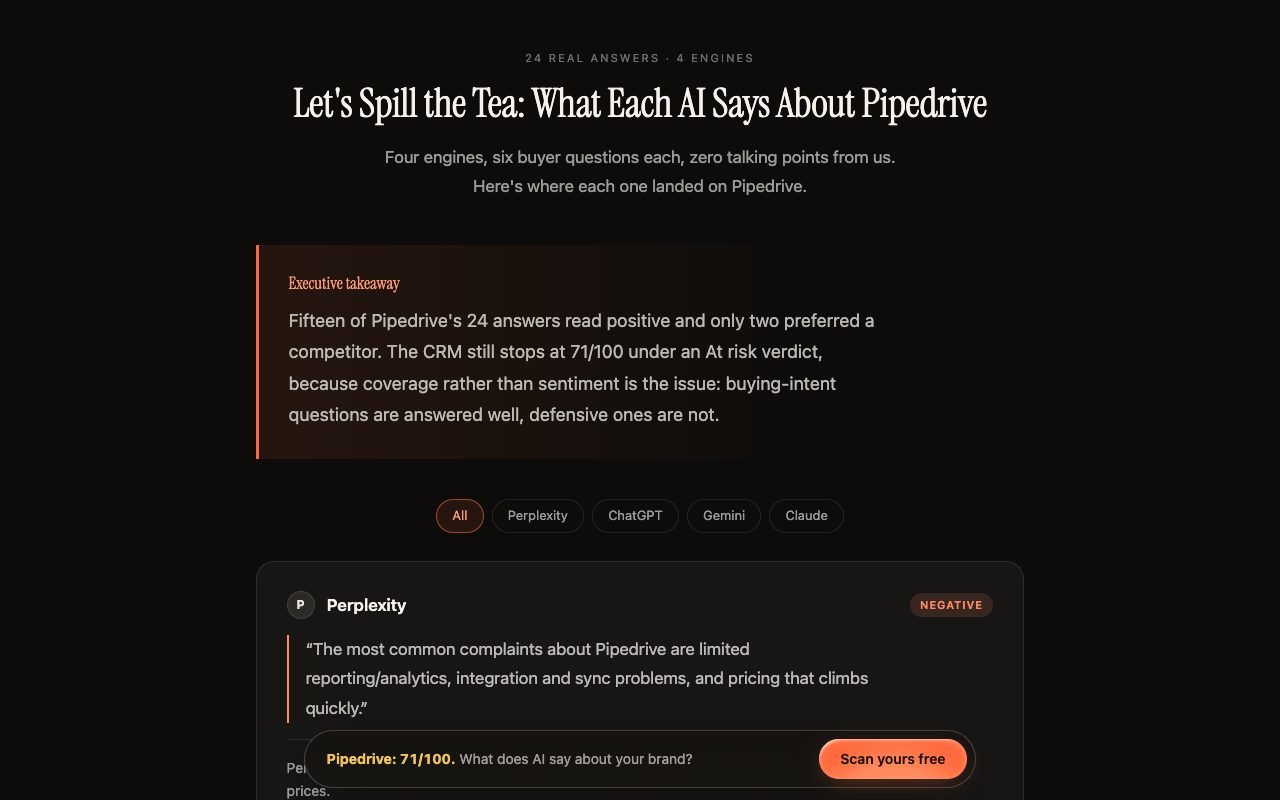
Kairosy's public scans keep these ingredients apart on purpose. The public scan of Pipedrive shows a 71/100 reputation score built from 24 answers dated 1 Aug 2026. That number is a reputation composite: every answer is classified as positive, neutral, negative, prefers a competitor or does not know the brand, then scored, and the 0–100 is the weighted average. The 92% labeled Visibility on the same page is recognition, meaning engines knew the brand when asked about it by name, which is a different ingredient from an unbranded appearance rate.
Why Can't You Compare AI Brand Visibility Scores Across Tools?
Because the tools disagree on every part of the fraction. The table is built from each vendor's own documentation, checked on 21 Oct 2026. Read the denominator column twice.
| Tool and metric | Numerator | Denominator | Prompt source | Position or sentiment in the headline? |
|---|---|---|---|---|
| Peec, Visibility | Responses mentioning your brand | All tracked responses | Prompts you define | No (separate Position and Sentiment metrics) |
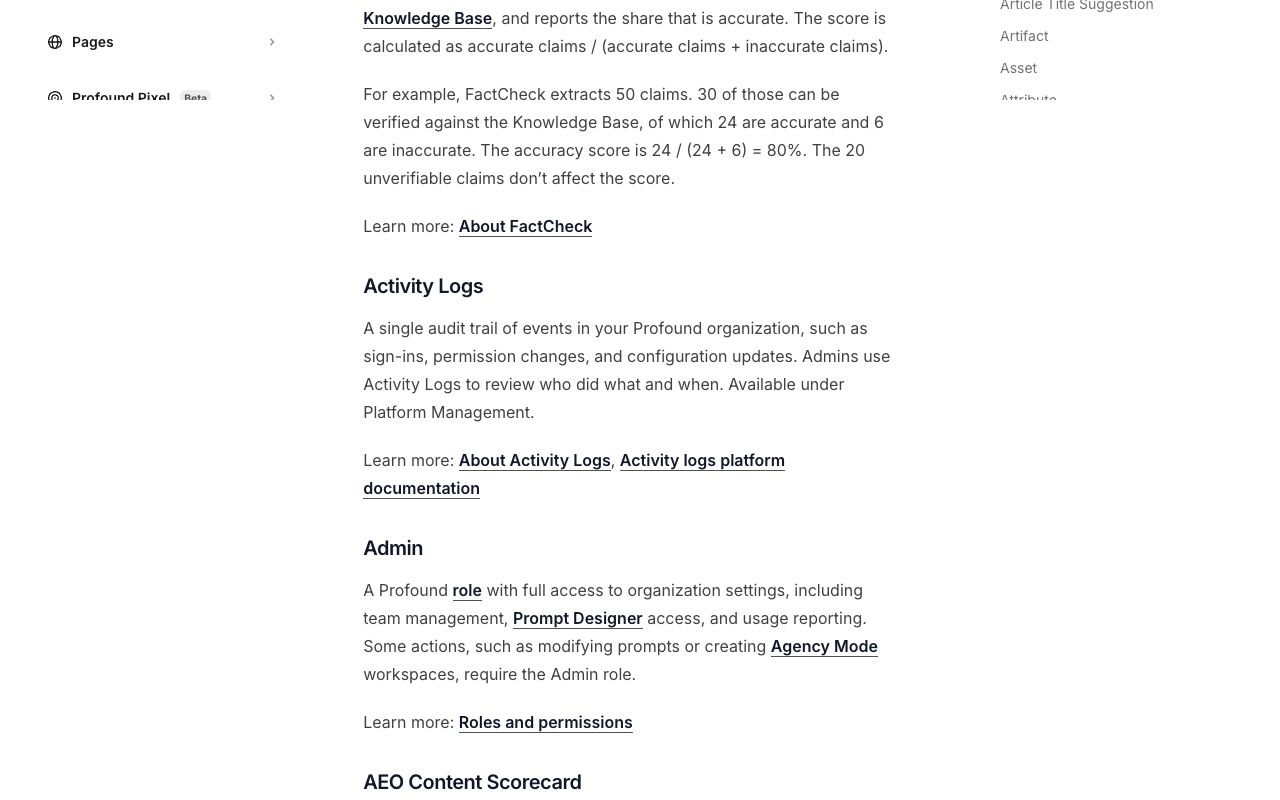
| Profound, Visibility Score | Responses mentioning your brand | Responses naming at least one brand | Prompts you define | No (Position is a separate ranked score) |
| Ahrefs Brand Radar, AI Share of Voice | Modeled impressions of your mentions | Modeled impressions of all tracked brands | Index of about 78.5M queries a month | No (impressions modeled from Google volume) |
| Semrush AI Visibility Score | Normalized share of presence, 0–100 | Not published as a formula | Prompt database, 317M+ queries | No (Sentiment and Average Position separate) |
| Kairosy, Reputation 0–100 | Per-answer sentiment classification, including whether a competitor is preferred | Scored answers, per engine | Branded and unbranded buyer questions | Yes (sentiment and recommendation are the score) |
Look at the first two rows. Peec divides by every response; Profound divides only by responses that name at least one brand (Profound glossary). If four of twenty answers name nobody, the same brand with the same ten mentions reads 50% in one tool and 62.5% in the other.
Now the prompt source column. Ahrefs runs an index it describes as about 78.5 million queries a month across ChatGPT, Perplexity, Gemini, Copilot, AI Overviews, AI Mode and Grok, weights impressions by Google search volume, and states plainly that it does not claim a validated link between Google volume and how often a query is asked inside an AI tool (Ahrefs methodology post, 26 Feb 2026). Semrush describes its score as a normalized benchmark of presence across Google AI Overviews, AI Mode, Gemini and ChatGPT, drawn from a 317M+ prompt database (Semrush KB). A tracker running your fifty handwritten prompts measures a different universe than one sampling hundreds of millions.
Engine lists differ too: Semrush lists four platforms on its overview page, Ahrefs seven, Kairosy six with four chosen per project, and each engine cites and hedges differently, so different mixes yield different numbers for the same brand on the same day. Weighting differs as well; QueryBurst's comparison of prompt trackers notes that some vendors apply geometric position decay to the headline and others none (QueryBurst, Sept 2026).
The practical rule: compare AI brand visibility scores only within one tool, one prompt set and one engine list. Across tools, compare direction and rank order, never the number.
How Do Two Scoring Methods Turn the Same Appearance Rate Into Different Totals?
Every figure below is an example value for a fictional brand, Northwind, and a fictional rival, Contoso. Nothing in this table was measured.
Setup: 20 responses in total (five prompts across four assistants). Northwind is named in 10, so its raw appearance rate is 50%. Four of the twenty responses name no brand at all. Of Northwind's 10 appearances, 2 are the first recommendation, 3 are second, 5 are third or later; 6 read positive, 3 neutral, 1 negative. Contoso is also named in 10 responses, but 6 of those are first position, 3 second and 1 later.
| Method (example values) | Formula | Northwind | Contoso |
|---|---|---|---|
| A. Plain appearance rate | mentions ÷ all 20 responses | 10 ÷ 20 = 50 | 10 ÷ 20 = 50 |
| A2. Appearance rate, branded denominator | mentions ÷ 16 responses naming any brand | 10 ÷ 16 = 62.5 | 10 ÷ 16 = 62.5 |
| B. Position-weighted score | (first × 1.0 + second × 0.6 + later × 0.3) ÷ 20 | (2 + 1.8 + 1.5) ÷ 20 = 26.5 | (6 + 1.8 + 0.3) ÷ 20 = 40.5 |
| C. Sentiment-filtered rate | (positive + neutral mentions) ÷ 20 | 9 ÷ 20 = 45 | depends on its sentiment split |
Same brand, same answers, same 50% appearance rate, and the "score" is 50, 62.5, 26.5 or 45 depending on the method. Northwind and Contoso tie under A and A2 and sit 14 points apart under B. The position weights (1.0, 0.6, 0.3) are illustrative; geometric decay or a different cutoff would produce a different gap again.
Which is right? A answers "do engines know us?", B "do engines put us first?", C "when they name us, is it good news?" A buyer-facing brand usually needs B and C; an unknown brand needs A first. Pick the method that matches the business question, write it down, and never switch mid-trend.
How Do You Build Industry and Competitor AI Visibility Benchmarks?
Competitor AI visibility benchmarks are something you build, not something you download. The steps below take one afternoon to set up and one scan cycle to populate.
Step 1: Split performance by platform, question type and purchase stage
One blended number hides the pattern that matters, so keep three splits from day one. By platform, because an engine that never names you is a different problem from one that names you and warns people off. By question type, separating unbranded category questions ("best CRM for a 10-person sales team") from branded ones ("is Pipedrive worth it"): the first measures discovery, the second reputation. By purchase stage, tagging prompts awareness, evaluation or decision to see whether you lose at the shortlist or the final pick.
The table lists six CRM brands from Kairosy's public scans, each on 24 answers dated 1–5 Aug 2026. It is a peer set from one scan series, not an industry standard, and each public page shows how its numbers were derived.
| Brand (Kairosy public scan) | Reputation 0–100 | Positive answers | Visibility (brand recognition) |
|---|---|---|---|
| Zoho CRM | 74 | 54% | 100% |
| Pipedrive | 71 | 63% | 92% |
| Close | 71 | 58% | 92% |
| Freshsales | 65 | 46% | 100% |
| Attio | 63 | 46% | 100% |
| Copper | 52 | 33% | 88% |
Recognition barely separates the set, with five of six brands at 92–100%. Reputation and positive share do the separating. Copper is recognized in 88% of its branded answers and still lands 22 points below Zoho CRM, because engines describe it as the tool teams leave. A blended visibility number would have hidden that gap.
Step 2: Add sample size, repeats and a variance note
Twenty answers is a thin sample, and your benchmark sheet should say so. Using the Wilson score interval that Evan Miller popularized for rating systems (evanmiller.org, 2009), a 50% appearance rate on 20 answers carries a 95% interval of roughly 30% to 70%. On 100 answers it narrows to 40–60%; on 400 it is 45–55%. A five-point move on 20 answers is noise; on 400 it is a signal.
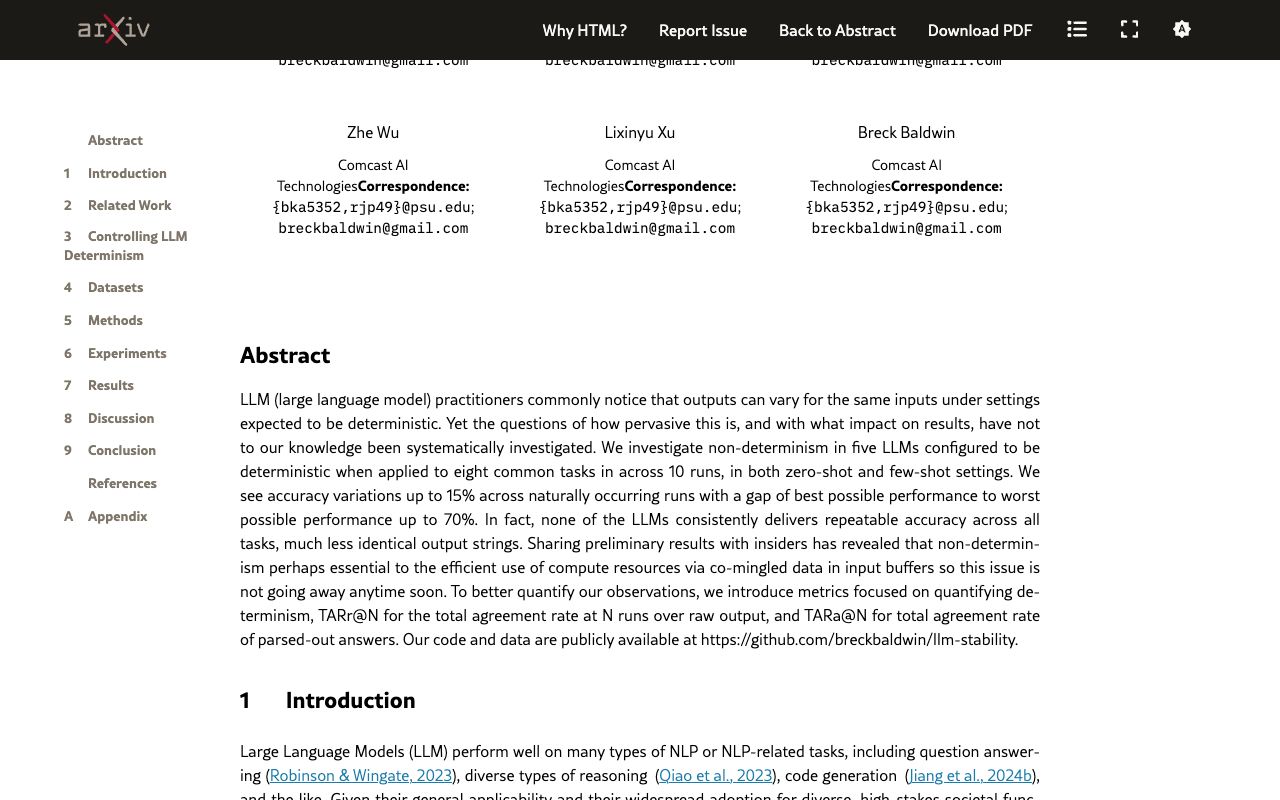
Repeats matter even at fixed settings. A 2025 study of five LLMs across eight tasks, ten runs each at temperature zero, found accuracy varying by up to 15% between runs that should have been identical (arXiv 2408.04667). It measures task accuracy, not brand mentions, but the mechanism carries over: identical inputs do not guarantee identical outputs. Run each prompt at least three times per engine before you trust a rate, and record the spread next to the mean.
Step 3: Find the executable gap behind a low score
A low number is only useful when it points at a page. Work the splits backward: which engine, which question type, which stage. If unbranded awareness prompts on Perplexity never name you, check whether its crawler can reach you with the free AI crawl checker, then look at which domains the engine cites for the category instead. If branded evaluation prompts name you but recommend a rival, read the cited sources; the fix is usually a comparison page the engines can quote, not more mentions.
Step 4: Monitor and improve on a fixed cadence
Benchmarks decay. Engines retrain, competitors publish, cited sources rotate. Re-run the same prompt set on a schedule you can keep, and chart the trend per engine rather than the blend. Kairosy's AI brand monitoring re-runs tracked prompts daily and deep-rescans each brand weekly, then emails score drops, a competitor being preferred and new negative keywords. There is no live alerting, and a weekly cadence is honest about how fast these systems actually move.
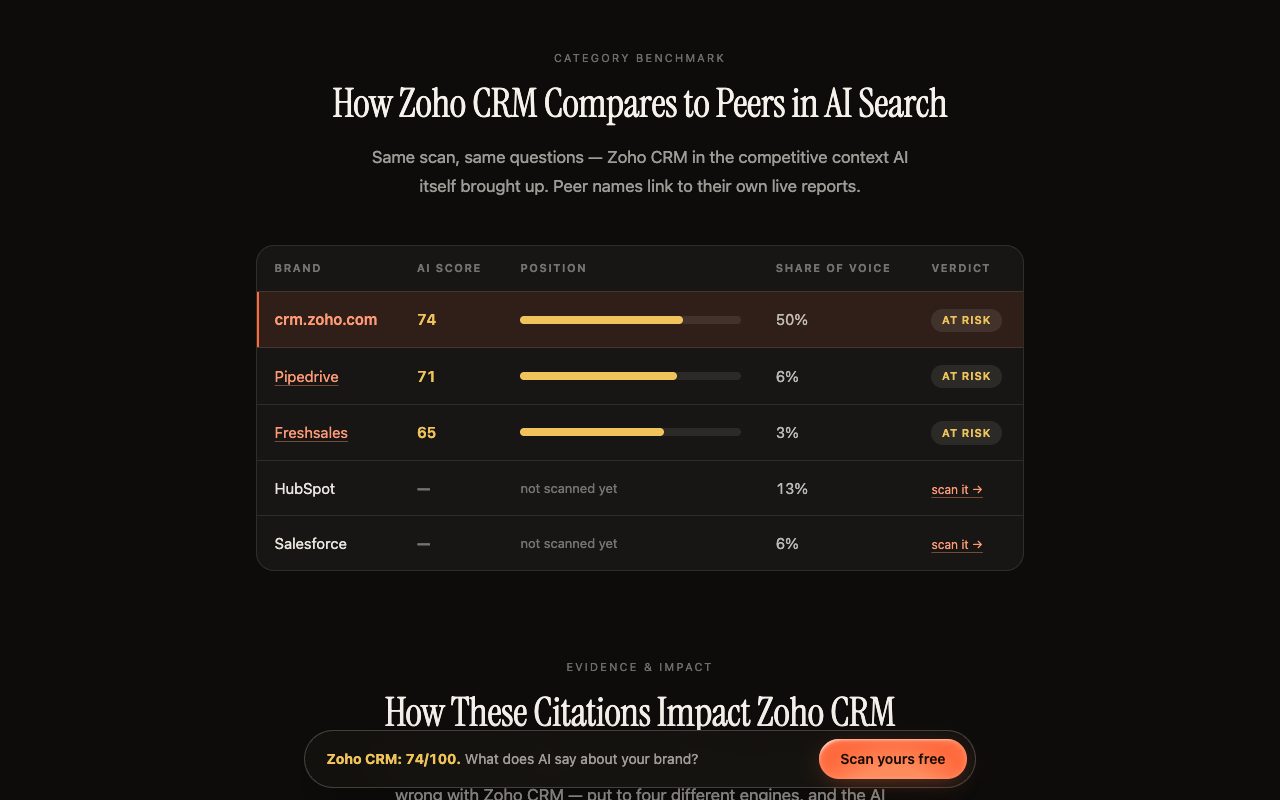
That trend view, same brand and prompts across several scans, is where a benchmark should be read, not off a single run. For the fuller protocol, see how to monitor AI search visibility.
What Do Teams Ask About a Good LLM Brand Visibility Score? FAQs
Is 50% a good LLM brand visibility score?
Only relative to a baseline. Fifty percent of twenty answers carries a 30–70% confidence interval, and a 50 on a position-weighted method means something different from a 50 on a plain appearance rate. Compare it to your previous run and to named competitors on the same prompts, then decide.
Why does my brand score differently in two tools on the same day?
Because the tools use different prompts, engines and denominators. Peec divides by all responses, Profound by responses naming at least one brand, Ahrefs by modeled impressions. Each is internally consistent; none is comparable to another. Track trend and rank order within one tool.
How many prompts and runs do I need before the score is trustworthy?
Enough that your confidence interval is narrower than the change you want to detect. At a 50% rate, 100 answers give roughly plus or minus 10 points and 400 give plus or minus 5. Run each prompt at least three times per engine, since identical settings still produce different outputs.
Should visibility or sentiment be the headline number?
Depends on your problem. If engines rarely name you, appearance rate is the headline and sentiment is moot. Once you are named in most relevant answers, sentiment and recommendation position decide revenue, which is why Kairosy's reputation score is built from per-answer sentiment and whether engines recommend the brand, not from mention counts.
Can I use a vendor's published benchmark as my industry standard?
No. A vendor's range describes its own prompt database, engine list and formula, and a research paper's distribution describes its own benchmark queries. Use them to sanity-check direction, then build competitor AI visibility benchmarks from your own prompt set.
How often should I rebuild the benchmark?
Re-run on a fixed cadence and rebuild the competitor set quarterly, since engines retrain and cited sources rotate. Keep the prompt set and method fixed between rebuilds so the trend line stays meaningful.
See what AI says about your brand
Run a free scan across ChatGPT, Gemini, Claude & Perplexity in about 30 seconds.
Run my free scan